
Benjamin Disreali once said that there were three kinds of lies: Lies, Damned Lies and statistics.
Having been in a number of jobs that need me to use mathematics on a daily basis, when presented with statistics which allegedly prove a point, I'm very quick to ask for the raw data to understand how the statistics were calculated and to check that they're right. I was recently asked to take a look at some road speed statistics and I was given the following data:

What we have here is a table showing the Mon-Sun average speeds for the 02:00 to 03:00 time block. What the spreadsheet author has done is to sum the average speeds to the left and divide by 7 or 5 to get an average. However this leads to inaccuracies: what we're getting is an average of an average here rather than the true picture. The Monday to Friday sample sizes vary from 0-8 cars and the 8 car hour is getting the same weighting as an hour with just 1 car passing through.
Naturally, I went back to the source of the data and recalcuated using the correct sample size, and this is what I found:
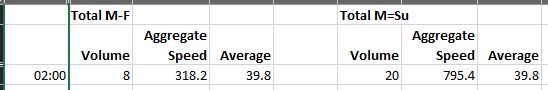
As we can see, both the 5 day (M-F) and 7 day (M-Su) averages come out as 39.8 mph (vs 43 and 44 mph) when the average is correctly weighted. This error could easily have led to the wrong conclusion being drawn from these statistics.
This phenomena is known as Simpson's Paradox and I think should be one of the first things taught to anyone dealing with statistics. The lesson here is that if you see an average of an average, ask for the raw data and recalculate. The conclusions drawn may be on faulty data.